
KeyPathwayMinerWeb Tutorial
To learn how to use KeyPathwayMinerWeb have a look at our video tutorial or follow the step-by-step guide provided below.
Step by step guide
Authors: Martin Dissing-Hansen, Markus ListKeyPathwayMinerWeb enables de novo network enrichment in the browser. This web application uses the same KeyPathwayMiner implementation that is also used by the Cytoscape App. The focus on KeyPathwayMinerWeb is on simplicity and ease-of-use. The web interface presented here does therefore not contain all of the functionality provided by the Cytoscape App. Advanced users are encouraged to learn how to use the Cytoscape App. Programmers are encouraged to use the RESTful API for programmatic access to the KeyPathwayMiner library through this web application.
User Interface
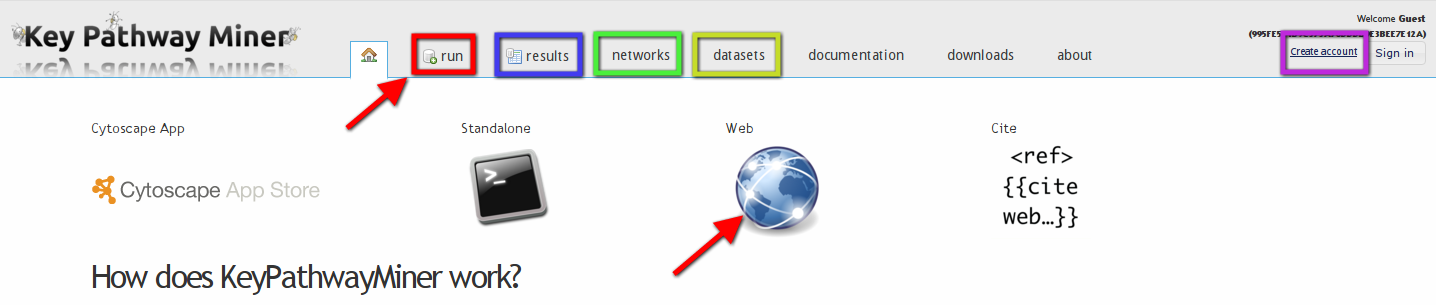
The header of the KeyPathwayMinerWeb application.
Here is a short description of the main functions accessible through the navigation bar in the header:
- run: Click on this tab to start a new KeyPathwayMiner analysis. The same can be achieved by clicking on Web (also indicated by a red arrow)
- results: If a run was previously started, its progress can be monitored in this tab and the selected settings can be reviewed. For runs that have already been completed, the results can be opened.
- networks: KeyPathwayMiner Web provides selected interaction networks by default. However, should you wish to study other organisms than human or should your dataset contain other IDs than entrez gene ids, you should go to this tab to upload your own network file. Note: Only SIF files can be accepted at the moment.
- datasets: KeyPathwayMiner comes with a small selection of demo datasets. Before you start your analysis, you probably want to upload your own experimental data here. Note that uploaded datasets are only visible within the current guest session or to the logged in user.
- create account: Optionally, it is also possible to sign up for a user account, which has the advantage that results can later be opened without the need to bookmark the session link. This is done via the “create account” link in the right side of the header.
Step 1 - datasets
In order to upload your own custom experimental data click on the datasets tab in the navigation menu. Then click on upload and enter the required information. You can choose to upload an indicator matrix where active genes / nodes are indicated by 1 (0 otherwise). Alternatively, users can select numerical matrix and upload a matrix of numerical values, e.g. p-values or fold changes. These can then be converted to an indicator matrix on the fly with a user-defined threshold.
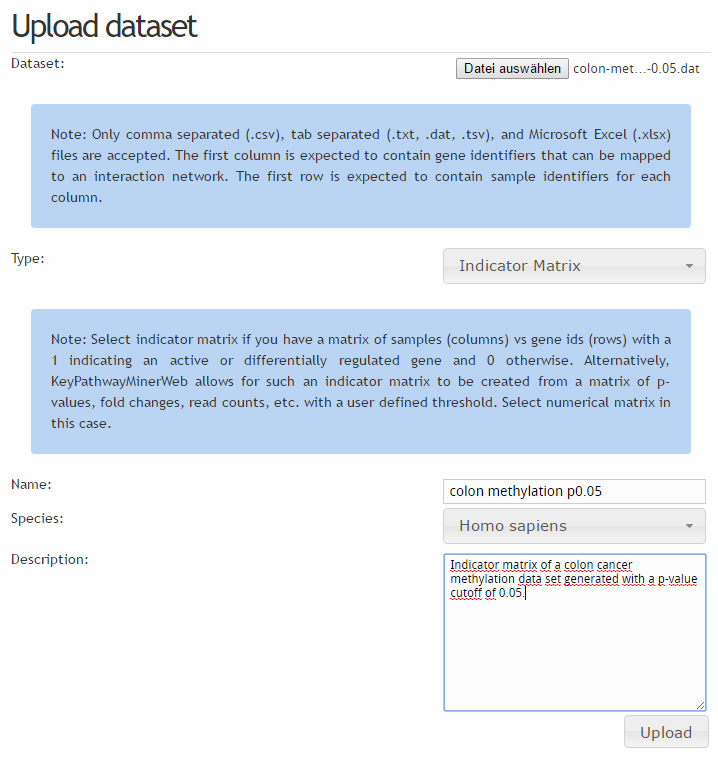
Uploading a custom dataset.
After a successful upload, the dataset is available for analysis and can also be deleted again:
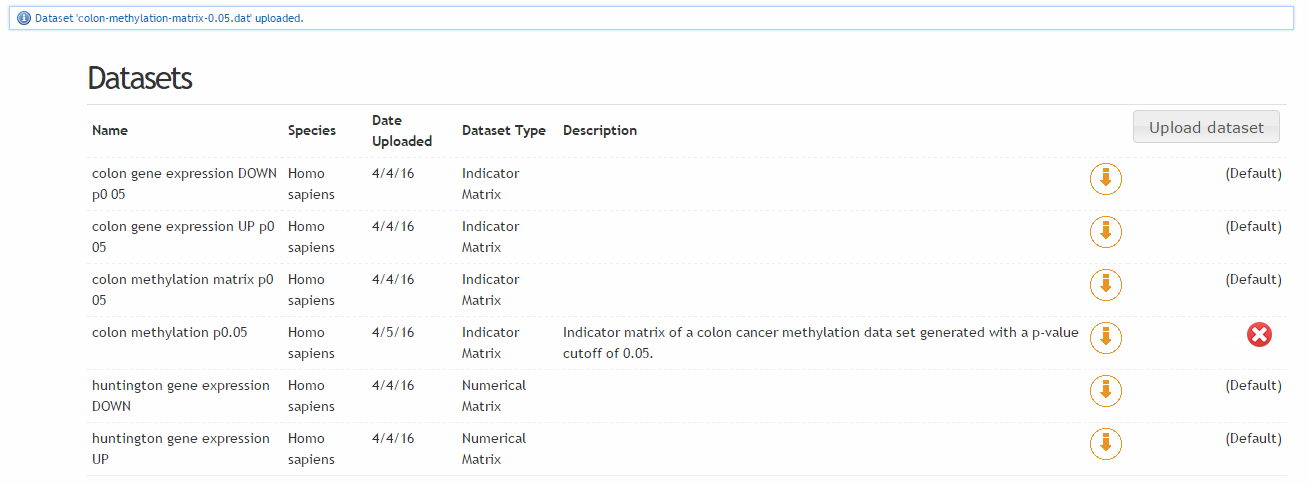
A list of available datasets.
Should you also have your own network file for analysis, click on the 'networks' menu button and proceed as you did for the custom dataset. After this, you can start the KeyPathwayMiner analysis by clicking on 'run' in the navigation menu. Here, you may select one or several of the uploaded or default datasets. For multiple datasets you have to decide how you want to logically combine them. In KeyPathwayMinerWeb you can choose between
- AND: A gene / protein is considered active only if it is active in all datasets
- OR: A gene / protein is considered active if it is active in any of the datasets
If you need more flexibility consider using the Cytoscape app of KeyPathwayMiner, which has a formula editor that allows you to connect different datasets in more complex ways. Finally, you can also add previous knowledge:
- Positive nodes: Enter here genes or proteins you know are involved in your study. These will then be added to solutions where possible and do not count as exception nodes.
- Negative nodes: Enter here genes or proteins you want to exclude from the results. This could be, for instance, genes that are dominating the solutions but are not interesting in your study.
Note: You are required to add one gene per line and only network compatible ids are considered, i.e. if you use a network based on entrez gene ids you also have to use entrez gene ids here. Values added here can also be uploaded. When you have entered all the information above, click on 'next' to continue.
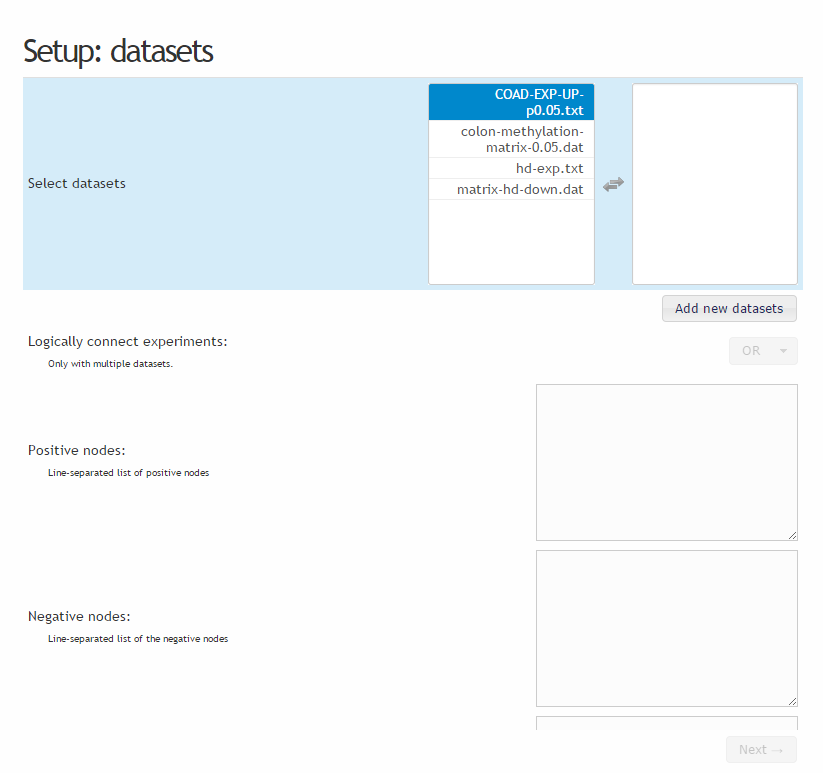
Setting up datasets and special nodes.
Should you have uploaded one or several numerical data matrices you need to define a threshold for each of them. Values < or > than the selected threshold will be considered active:
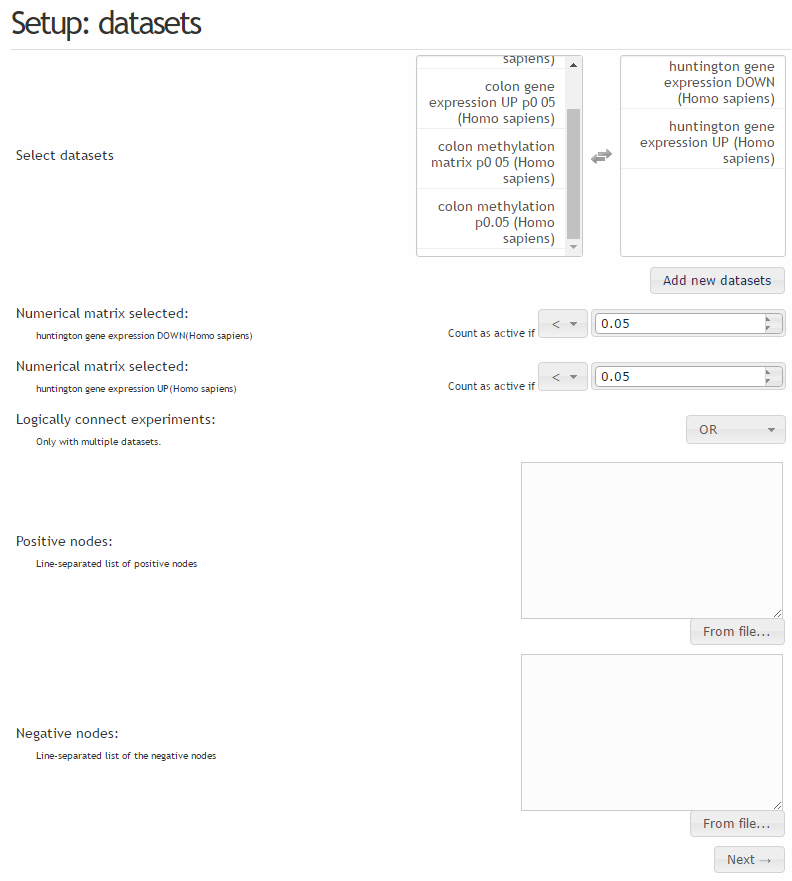
For numerical matrices, a threshold needs to be defined.
Step 2 - Parameters
In this step, the rest of the main parameters are set up. This includes
- The name of the run
- The selected network
- The search algorithm: currently only greedy search is supported in KeyPathwayMinerWeb. In the Cytoscape app you will also have the option to use 'Ant Colony Optimization' and a 'Fixed Parameter Tractable' algorithm.
- Strategy: Can be either individual node exceptions (INES), where case exceptions are checked individually for each gene or global node exceptions (GLONE), where case exceptions are considered globally for all genes in a potential solution.
- Node exceptions (K): For INES, two parameters are set. One is K, the number of allowed exception genes that can be added to a potential solution. K is not needed for GLONE.
- Case exceptions (L): This is the number of case exceptions, i.e. in INES this corresponds to the number of non-active samples to be allowed for each gene or the global number of non-active samples in case GLONE was selected. In the web application L is expressed as a % of the number of samples in a dataset. Use the Cytoscape App if you would like to assign absolute values.
- Remove border exception nodes: In case INES was selected, exception nodes are thought to connect smaller solutions into larger ones. However, in many cases exception nodes will just be dangling nodes at the periphery of the solution. As a result, many solutions are identical except for the exception genes. This is typically undesired and this option allows you to remvoe such genes automatically.
- Number of computed pathways: How many solutions you want to consider
- How to treat unmapped nodes: Typically not all of the nodes in a network are also found in the datasets. Unmapped notes can thus either be ignored (add to negative list) or be added to potential solutions (add to positive list)
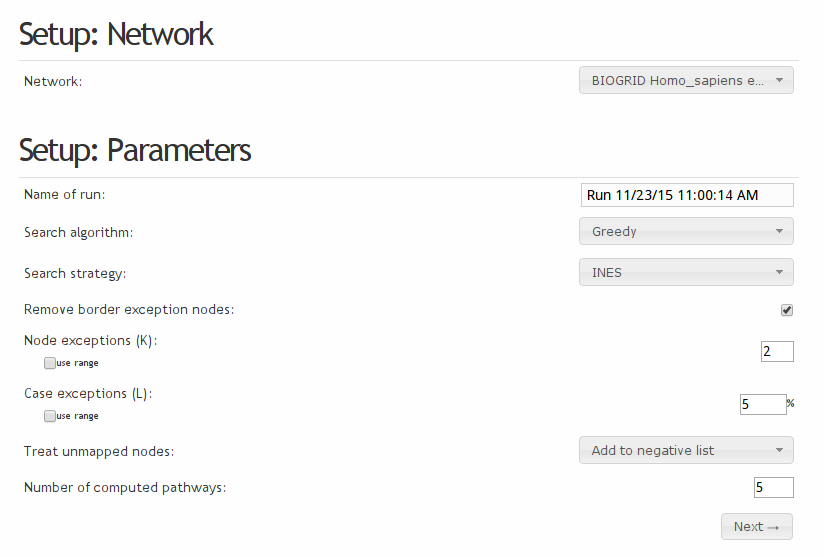
Setting up run parameters.
Step 3 - setup review
Once the configuration is complete, the setup can be reviewed. To proceed, press the green “start” button. You will be directed to the 'results' tab.
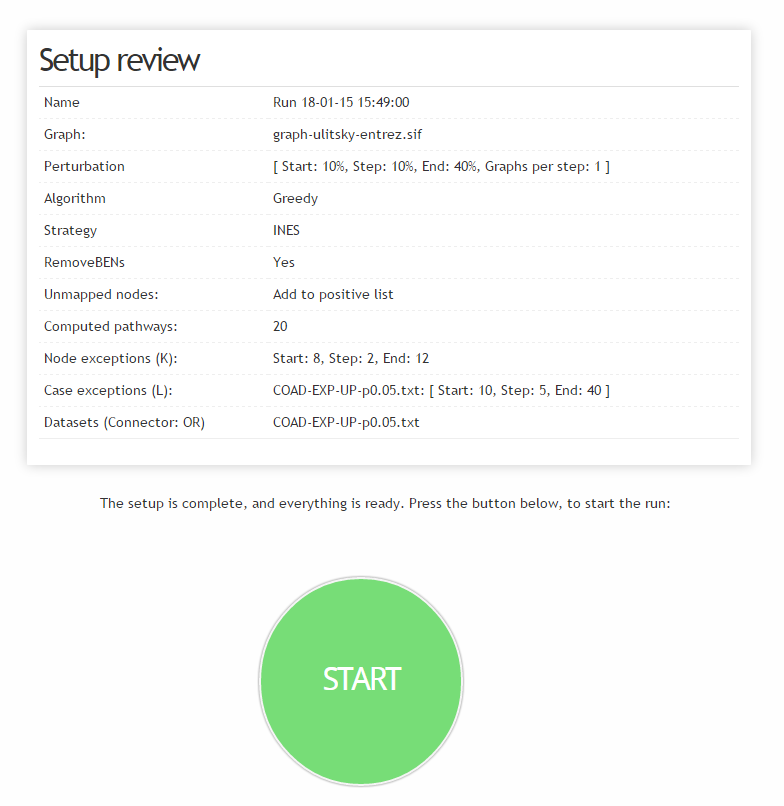
Reviewing settings.
Step 5 - current KPM runs
In the 'results' tab, the user can see all currently running and previously completed runs:
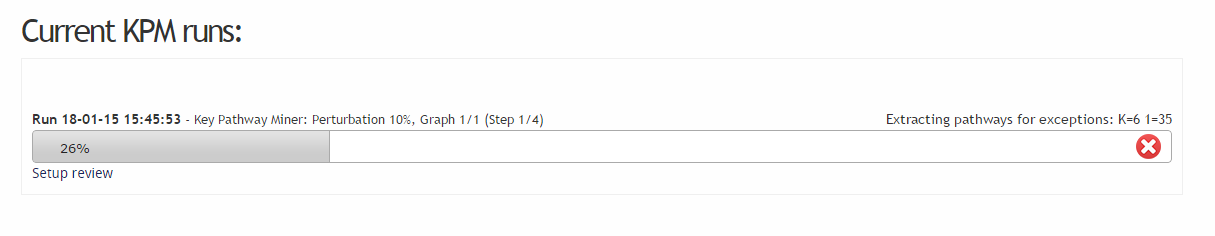
Current runs.
In case the user wants to review what the exact setup to a given run is, a click on the “setup review” will show the modal overlay visible on Figure 5b.
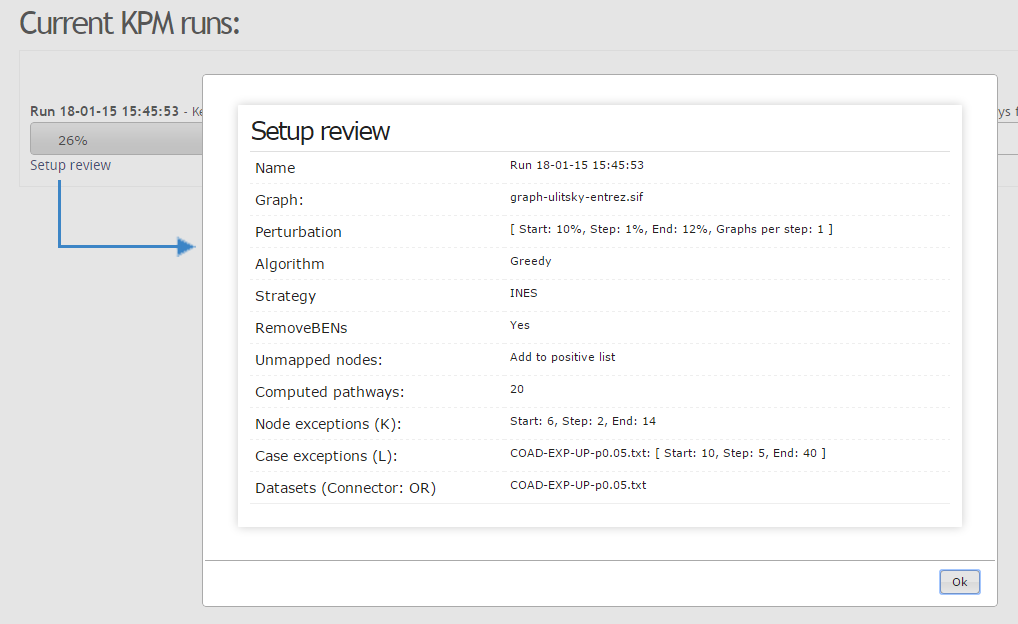
Current runs, review of settings for a given run.
Step 6 - results
Once a run is completed, a 'see results' button will appear underneath the loading bar. Pressing this button will redirect the user to a result page. Here, the following is shown:
- Two sliders that allow for selecting different K and L values (if K and/or L were ranged)
- The option to substitute the node labels, for example entrez gene ids with gene symbols.
- A pathways table summarizing the computed solutions, including the average expression (average number of active cases) and the information content of the solution. Clicking on an entry of the table will visualize the solution as an interactive graph (panning and zooming)
- A number of buttons:
- Update network and table: triggers a redraw of the solution, in particular after selecting node label substitution.
- Show union network: A colored representation of all solutions merged into one union graph. The colors correspond to the number of times a gene was found in total across all of the solutions (shown further below).
- Export to SIF: Export the current graph in a Cytoscape compatible format
- Export node ids: Export the gene ids of the selected solution. This enables the user to further investigate this solution in other programs.
- Toggle layout: For very large solutions (several hundreds of genes), the force directed layout of the solution graph can be time-consuming. To stop the layout process, this button can be pressed.
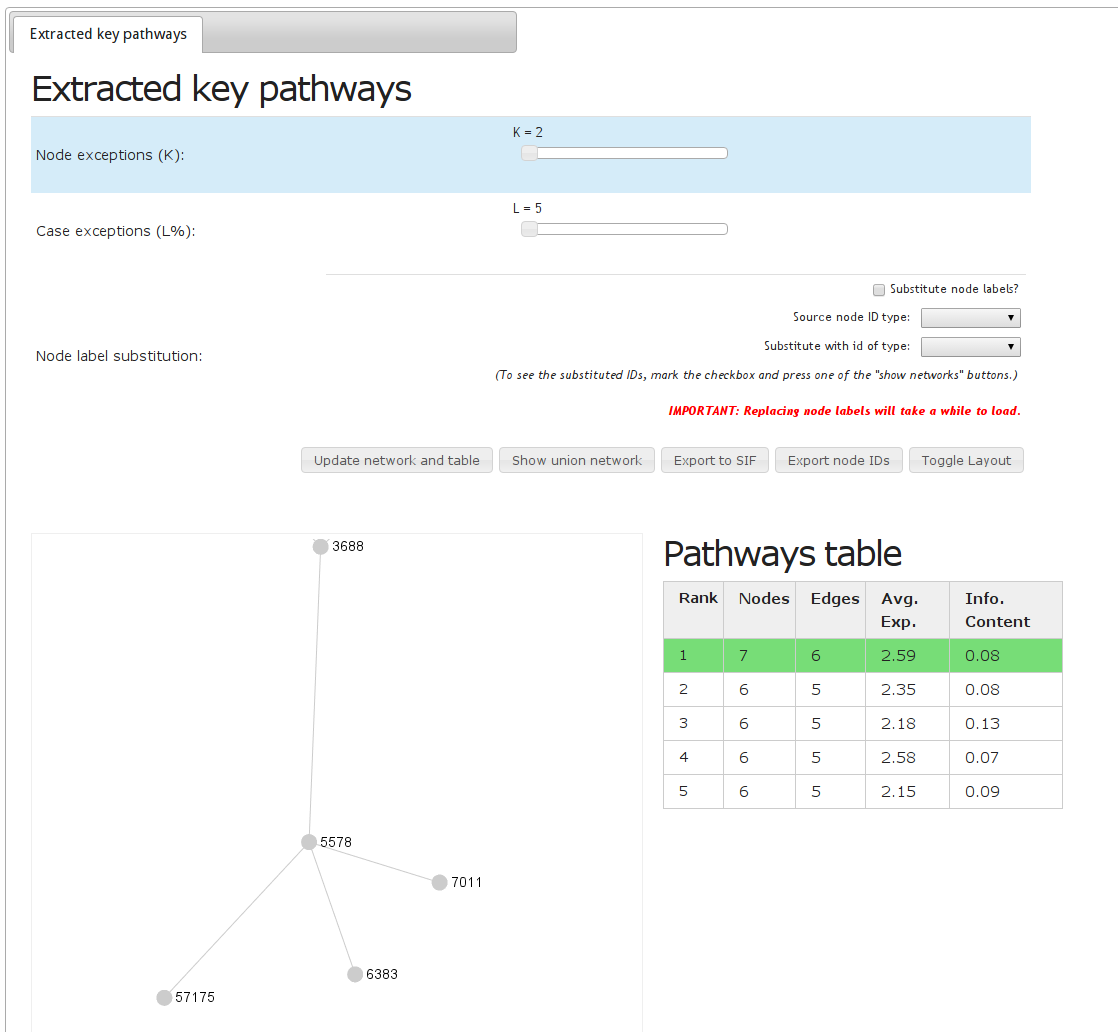
Result page
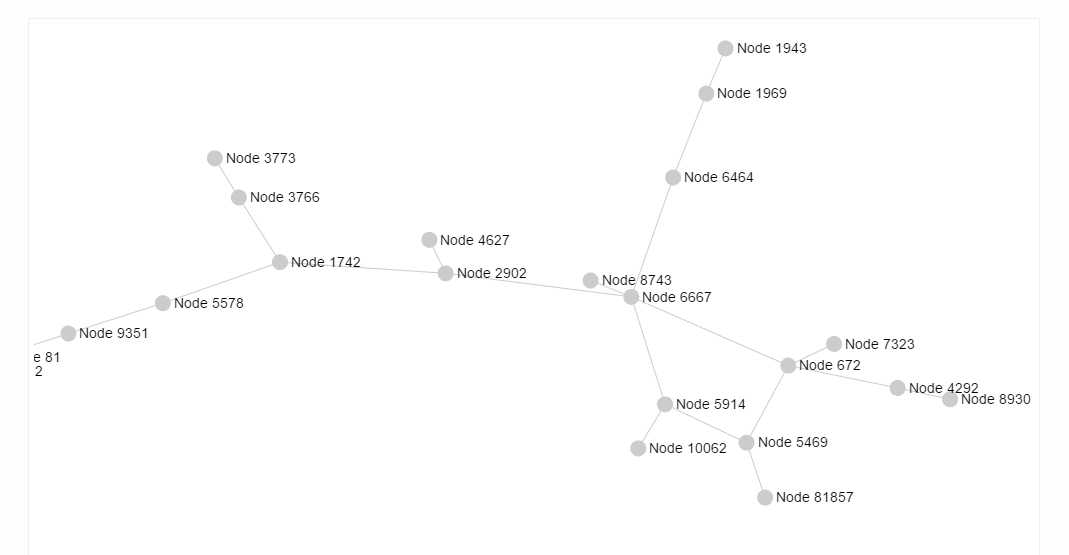
Example of a single selected solution
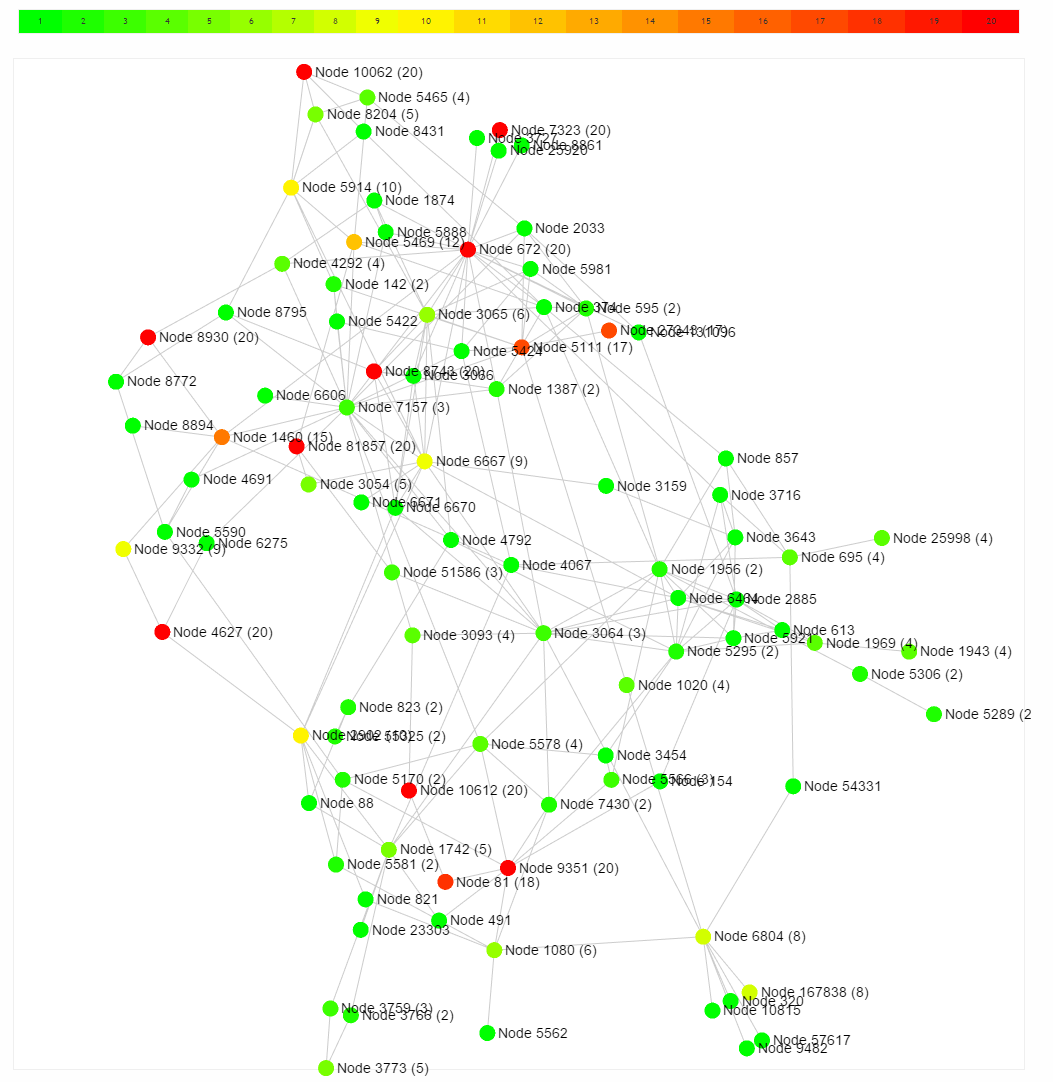
Example of a union graph representation of all solutions
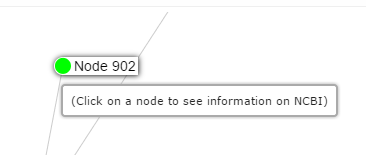
A node can be clicked, which will open the gene's page on the NCBI website.
Conclusion
In this tutorial, we show how de novo network enrichment analysis can be done online with only a couple of clicks. You should now feel confident to press the 'run' button in the navigation bar above and start your first own analysis!