|
|
|
Installation
- Download and
install Cytoscape.
Please make sure you have Java 1.6+ installed and configured!.
- To install the KPM plug-in with Cytoscape 3 and above, go to the Apps --> App manager and seach for KeyPathwayMiner.
Alternatively, you can download the Jar file and install it manually.
- Once the plugin is installed, it should appear in the Apps menu as "KeyPathwayMiner", if not try restarting Cytoscape.
- Click on the "KeyPathwayMiner" entry in the plugins menu. The KPM panel should now appear with cytoscape control panel.
KPM is now ready to be used !
|
|
Import Network
Click on File -> Import -> Network. Please check test set for file format.
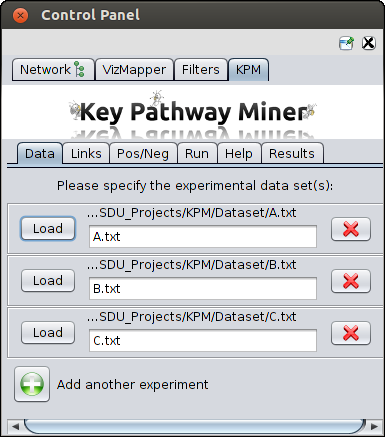
Load dataset(s)
Multiple inputs produced from gene expression studies, miRNA analysis, etc can be provided.
For example in the screenshot below you can see there are two datasets. You can click on the green button and upload more datasets.
Please check test set for file format.
|
|
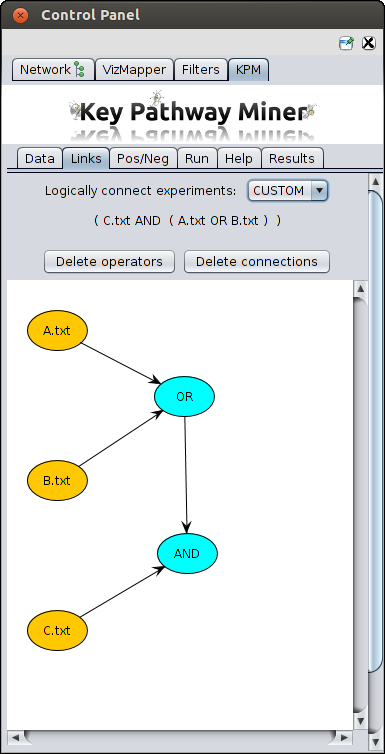
Link datasets
When you have more than one datasets, you can link these datasets in various ways.
- OR - A OR B OR C
- AND - A AND B AND C
- Custom - Using custom you can create complex links, for example (A AND (B OR C))
For this choose the custom option,
- Yellow nodes representing the datasets will be projected.
- Then you create a blue node by just right clicking on the empty space.
- You can change the type of operator (OR, AND, XOR) in a blue node by left clicking on it and selecting the
option from the pop-up menu.
- You can connect two nodes by right clicking on the source node and dragging it to the destination node.
- You can see the resulting logical formula above as can be seen in the screenshot below.
|
|
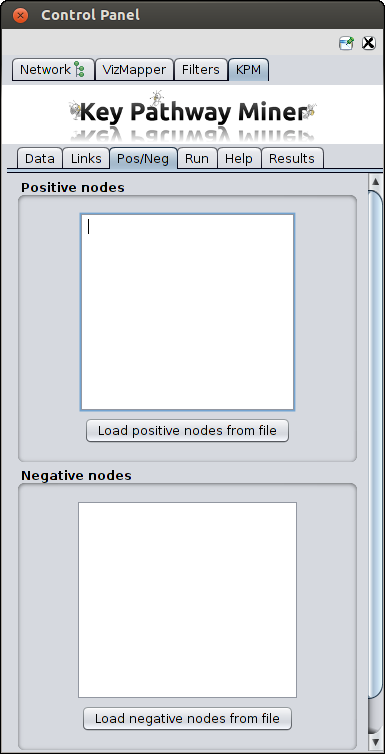
Add previous knowledge
These are optional parameters to specify the nodes which should have higher (positive nodes) or lower (negative nodes) priority
when searching for pathways. You can either paste a list or upload files with nodes ids.
|
|
Search options
|
|
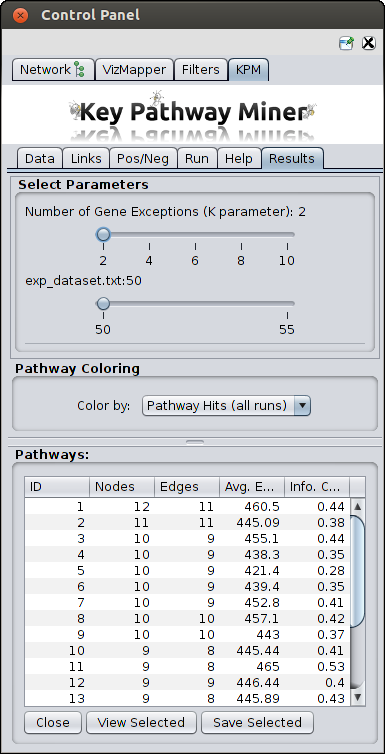
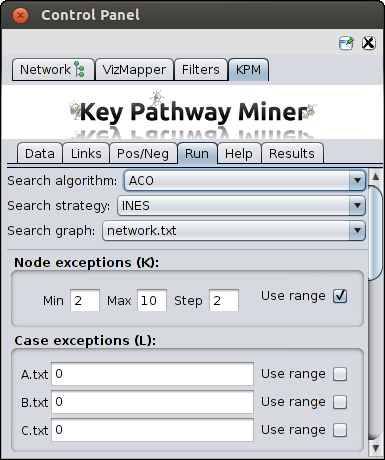
Basic parameters
After both the network and expression files are loaded, you can choose the following basic parameters:
- Exceptions
- Max. Gene Exceptions (K) - the maximum number of exception genes each pathway is allowed
to have. You can also provide a range to compute pathways with different K values.
- Max. Case Exceptions (L) - In INEs it represents the maximum number of non-differentially
expressed cases a gene is allowed to have in order to not be considered an exception gene. In GloNE it
represents the maximum number of non-differentially expressed cases over all genes contained in a solution.
You can also provide a range to compute pathways with different L values.
As you can see in the screenshot on the right, that you can provide range of K values and provide different range of L
for each of your dataset.
- Algorithm - The algorithm that will be used for extracting the pathways. Options are:
- Greedy - a fast greedy algorithm.
- ACO - the ant colony optimization meta-heuristic.
- Exact FPT - an exact fixed parameter tractability algorithm. WARNING: the complexity
increases exponentially with the number of exceptions allowed.
- Strategy
- Individual Node Exceptions (INEs) - Here we extract maximal connected subnetworks
where all genes but at most K are active in all but at most L cases.
- Global Node Exceptions (GLONE) - Here we extract maximal conneccted subnetworks
where the sum of NOT active cases from all genes is at most L.
|
|
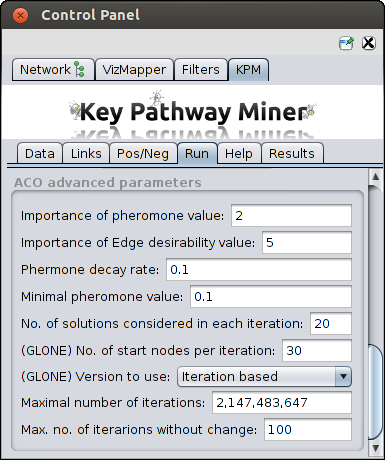
Advanced parameters
In case ACO is chosen Click on the arrow next to the "ACO Advanced Parameters" option to see and edit the following parameters:
- Importance of Pheromone Level (alpha) - Relevance to the amount of pheromone when constructing
solutions.
- Importance of Edge Heuristic value (beta) - Relevance given to the heuristic value when
constructing the solutions.
- Pheromone Decay Rate (rho) - This is the parameter for pheromone decay rate in order to avoid
fast convergence to suboptimal solutions.
- Minimal pheromone value - This is the parameter for the minimum level of pheromone a node can have.
- Number of solutions per iteration - How many solutions will be computed per iteration
(this can affect the runtime).
- Number of Startnodes - used by the GloNE approach, affects runtime.
- Version to use - used by the GloNE approach, Iteration based or Global search.
- Maximum number of iterations - This maximum number of iterations the algorithm will be allowed to run.
- Maximum iterations without change - How long is the algorithm allowed to run with no improvement
to found solutions.
The default parameters should be sufficient in most cases, tweaking the values from these parameters is only recommended
for advanced users.
|
|
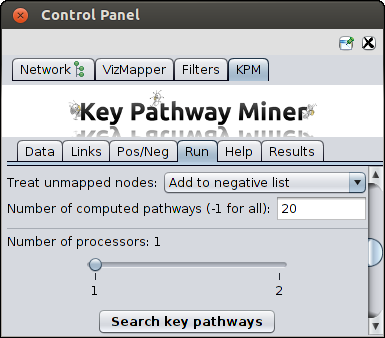
Other parameters
- Search graph - the graph to be used to find pathways (if you have loaded multiple networks)
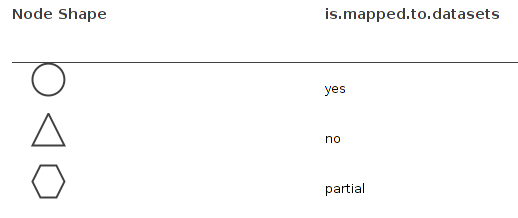
- Treat unmapped nodes - the nodes in the network which could not be mapped to OMICS data should be
treated as positive or negative nodes.
- Number of computed pathways - number of pathways to be computed. -1 should be given to compute
all the pathways.
- Number of Processors - in case multi-core architecture is available, you can choose the number
of processors to use for parallel computing which can reduce the runtime
|
|
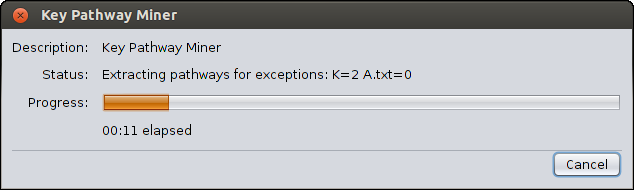
Search pathways
- Once all data has been loaded and the parameters are set, simply click on "Search key pathways" to start the
pathway mining process.
- A progress bar will appear showing how much of the process has been completed
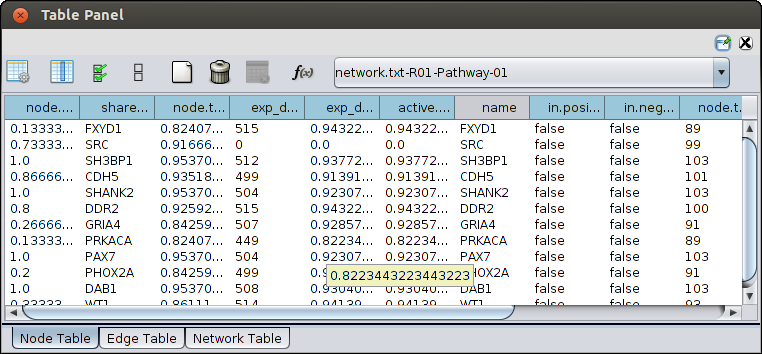
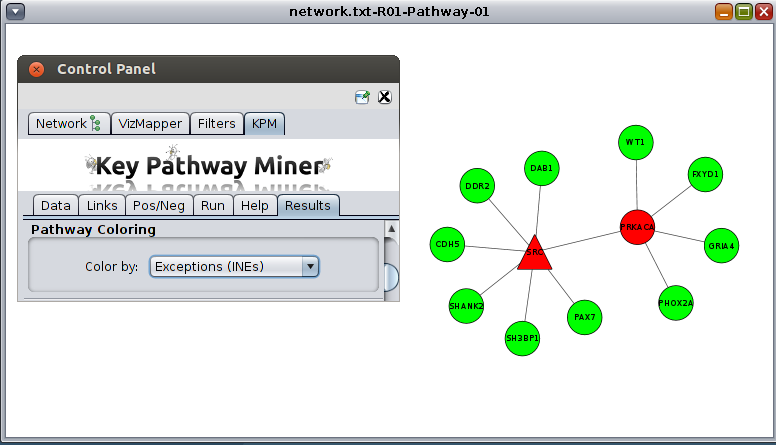
- Once the computation is completed, a new tab will appear with the results. You can then proceed with viewing the
results or re-run the algorithm with different parameters as many times as you like,
and new results will erase the previous results. So save the results before re-running.
- If for some reason you want to cancel the run, the interation will stop only after saving the already computed results.
|
|
|
|
Known Bugs with Cytoscape 3
- If you delete an existing network, cytoscape may throw a nullpointer and then hangs. You will have to restart Cytoscape.
- If the algorithm can not detect a pathway, the message "No pathways could be detected with these parameters.
Please try again with different parameters". But the program does not terminate here as expected
and as it occurs with Cytoscape 2.*. You have to manually cancel the search.
|
|
|
|
|
References
- Baumbach J, Friedrich T, Koetzing T, Kromer A, Mueller J, Pauling J (2012) Efficient algorithms for extracting biological key pathways with global constraints. Proceedings of the Genetic and Evolutionary Computation Conference, GECCO 2012, 2012, 169-176. (download from ACM)
- Alcaraz N, Friedrich T, Koetzing T, Krohmer A, Mueller J, Pauling J, Baumbach J (2012) Efficient key pathway mining - Combining networks and OMICS data. Integr Biol., 2012, 4 (7), 756 - 764. PubMed (download from RSC)
- Alcaraz NM, Kucuk H, Weile J, Wipat A, Baumbach J (2011) KeyPathwayMiner - Detecting case-specific biological pathways by using expression data. Int Math. 2011, 7:4, 299-313. (download from Tayler and Francis Online)
|
|
|
|
|
|
|
|